POW 1 Lab Report
Problem Statement
The inauguration of President Obama in 2009, was said to hold the record for the most people in a certain area. Our P.O.W was estimate out how many people attended. The only resource received was a bird’s eye view of the area, and the measurement of the capitol building’s stairs to the Washington Monument. Most of the people were in that area between the two buildings. We had to make a few assumptions, those were; that the area we chose was completely filled, with one person per square foot.
Process
The first thing that we did was observe the picture and all of the shaded spots. Those spots represent the people that attended, after a lot of close observing we decided that we would assume that the 1.2 miles between the Washington Monument and the stairs to the Capitol building. At 1.2 miles or 6336 feet we figured that the wideness of the area was 633.6 feet. The way we found these were by measuring the picture with a ruler, the stairs to the Washington Monuments was 10 inches, and we knew in real life that it was 1.2 miles so that made 1 inch 633.6 feet. 1 inch was the width of the area that we assumed was full of people. So the area was 6336 feet by 633.6 feet, equaling out at 4014489.6 square feet. At first we figured that one person could fit in a 2x2 so we estimated that there were 1003622.4 people there, but after some advice from Mr. Corner we figured that 1 person would fit more crammed into a 1x1 space making the amount of people 4014489.6, and our final answer. The assumptions were brought to us by Adam Lusk, and a lot of the math was done Ray Solis, and of course Mr. Corner who led us in the right direction a few times.
Solution
In conclusion my group has made an estimate and fulfilled the needs of the Problem Statement. Our final estimate was indeed 4014489.6 people attended the speech. Now keep in mind that, that is under a few assumptions that might vary the actual answer a bit. I know this estimate was correctly done because we spent hours putting all of the work together and brainstorming the problem, we have also checked our calculations multiple times to make sure it works.
Reflection
I learned one main thing from this project and that was how to properly write a Lab Report in Mr. Corner’s class. If I were to give myself a grade I would say a High B Low A, mainly because yeah I did a lot of the participating but not the most. The Habit of Mind that I would say reflects this lab, the best would be Cooperation, because Everyone at our group had to cooperate with each other and we did, well. This was important because everyone was contributing and throwing out there ideas and we had to be able to cooperate and figure out which ideas we would use.
POW 2 Lab Report
The more the Merrier
Kevin Belew
Problem Statment:
Population growth is a realistic thing, just over the last 50 years the population has grown from approximately 3 billion to almost 7 billion. That is an increase of 80 million people per year. One thing to look at is the different growth in the different countries. All of my findings are from the year 2000 and from the UN or the CIA world factbook.
Process:
First thing I did was some research to find the different populations and growths in different countries. Currently the top 3 populated countries are China, India, and United States. China is at 1.3 billion people, India at 1 billion and United States at 300 million. The population growth rates for these countries are China with a .49% increase, India with a 1.46% increase and US with a .97% increase. These calculations mean that India is growing the fastest with US then China behind. So according to the growth rate of India, the year after this current 1 billion recording, it would go up to 1.14 billion people populating India.
Solution:
In conclusion the amounts of people in India and China in particular is ridiculously high, since it triples the third competitor, US. If this growth rate keeps up or gets higher, then I see an overpopulation easily in the area of India, and China. I do not however think that the whole world will ever get to the point where each person only gets 1 square foot of space.
Reflection:
I have stated my opinions referring to the crazy amount of people in India and China, and that can lead to bad things in future such as Overpopulation in that area. India is increasing still, at an exponential rate.
P.O.W 3
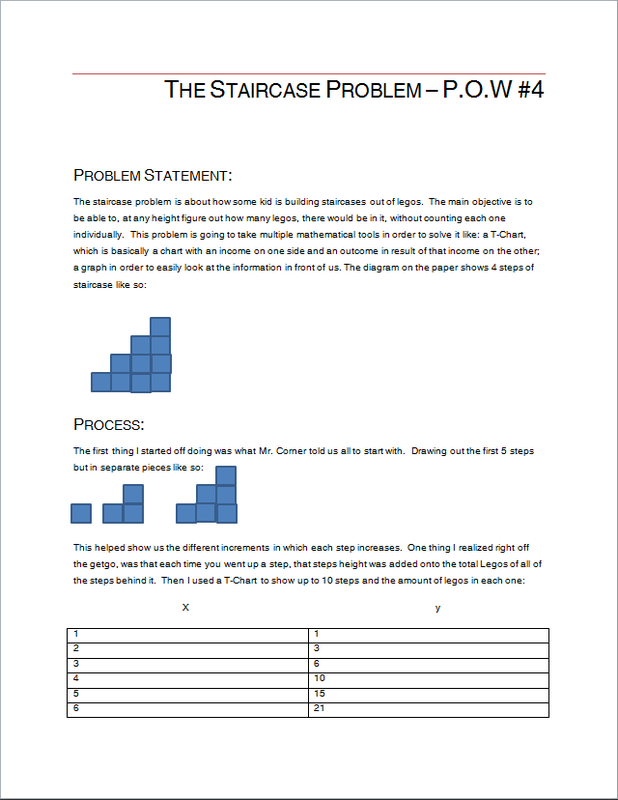
Problem Statement: There are a few things that needed to be done: for starters you have to decide the amount of platforms that there will be in the problem; you must decide on the height of the first platform in the row; and last you must decide on the difference in height between each platform. The overall thing you need to find out is how tall the highest column is.
Process: The first thing that I did was with the whole class start looking at the problem. The first thing we decided was the size of the smallest pillar. 1ft was the size we decided with an increase of 1 foot per pillar with 5 total pillars. So we decided t would equal highest platform, n equals 5, h equals 1ft, s equals n-1, and d equals 1 ft. h is the size of the first pillar, s is the gap between them.
Solution: H(t)=h+(n-1)d This works because it is basically saying the smallest platform h plus the gap between s times 4. This will find the height of the tallest/last platform.
Reflection: This is definitely not one of my strongest P.O.W’s mainly because this is the one that confused me the most I seeked help from my peers but had trouble understanding. Also my notes of working on it in class were hard for me to follow. So in the end I tried but definitely not my best.
Return to Small World isn't it? Project Portfolio
Cover Letter :
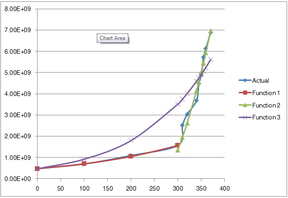
This entire unit that we have been working on has been all revolved around one idea if you will. “According to the population growth from 1650 to now, how long would it take for the world to be out of space, and every human only have a 1 square foot to themselves?” This topic sparked an initial assignment which we worked in groups to complete and come up with ideas of things for example: how much livable land is there on earth? This is important because once we know this in square footage we can see how many people it would take in order to get a person in each square foot on earth. Once we had come to a completion of this assignment with vague ideas of what exactly the answer could be we began work on smaller assignments all indirectly based off of the original topic see above. In these assignments we utilized some different math tools like: Derivatives, the point at which a curved line meets a tangent line that has the exact slope of the curved line; Linear Functions, a function (f(x)=a+bx) in which the end result line will be almost perfectly straight with no surprise bumps; Exponential Functions, a function (f(x)=k*e^cx) in which the end result can be somewhat sporadic and unpredictable, can go from straight to uprising or down falling in a moment’s notice. Both of these functions made an appearance on the road, to the answer to the main question, from 1650 to 1950 the line’s function was extremely linear, but come the baby boomers and it shot to the sky and became an exponential function. I believe that one of the most significant assignments in this unit would have to be the final: Return to Small World Isn’t it? This was a very heavy assignment for it had many different aspects, for starters we were given a graph of the 1650-2010 population growth. Then we had to come up with functions using the exponential format. Once we had some possible variables we input the function to see if it directly replicates the actual graph. In my case it covered the linear portion but stayed that way rather than shooting up. Eventually I came to the idea of having to functions, a linear and then a exponential and the results were quite promising.
As you can see in the following chart the blue line is the actual graph, and then purple was a close exponential only function I developed. Then red is a linear function and then it is combined with the exponential function of green.
Beginning Portfolios Assignment This is blended into my Cover Letter.
Return to Small World isn’t it? The graph is above as well as the work.
How Many More People? The work is with the portfolio.
California and Exponents The work is with the portfolio.
Personal Growth:
I feel like my ability to work well with others has always been existent, but I haven’t had much chance to use it, until this unit where it was almost all group work and it really helped me academically getting to interact with other people while learning it was a great asset for the work that I have completed and turned in, also getting other people to look at your work can benefit you greatly if maybe you missed something. I hope in the future to get the opportunity more to work in groups for large assignments such as this one.
P.O.W 4
|
|
